


1
2
3
4
5
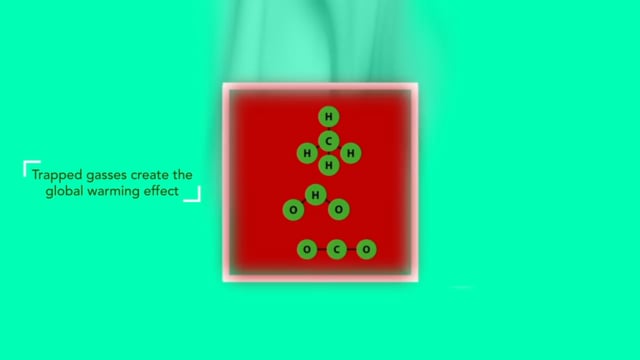
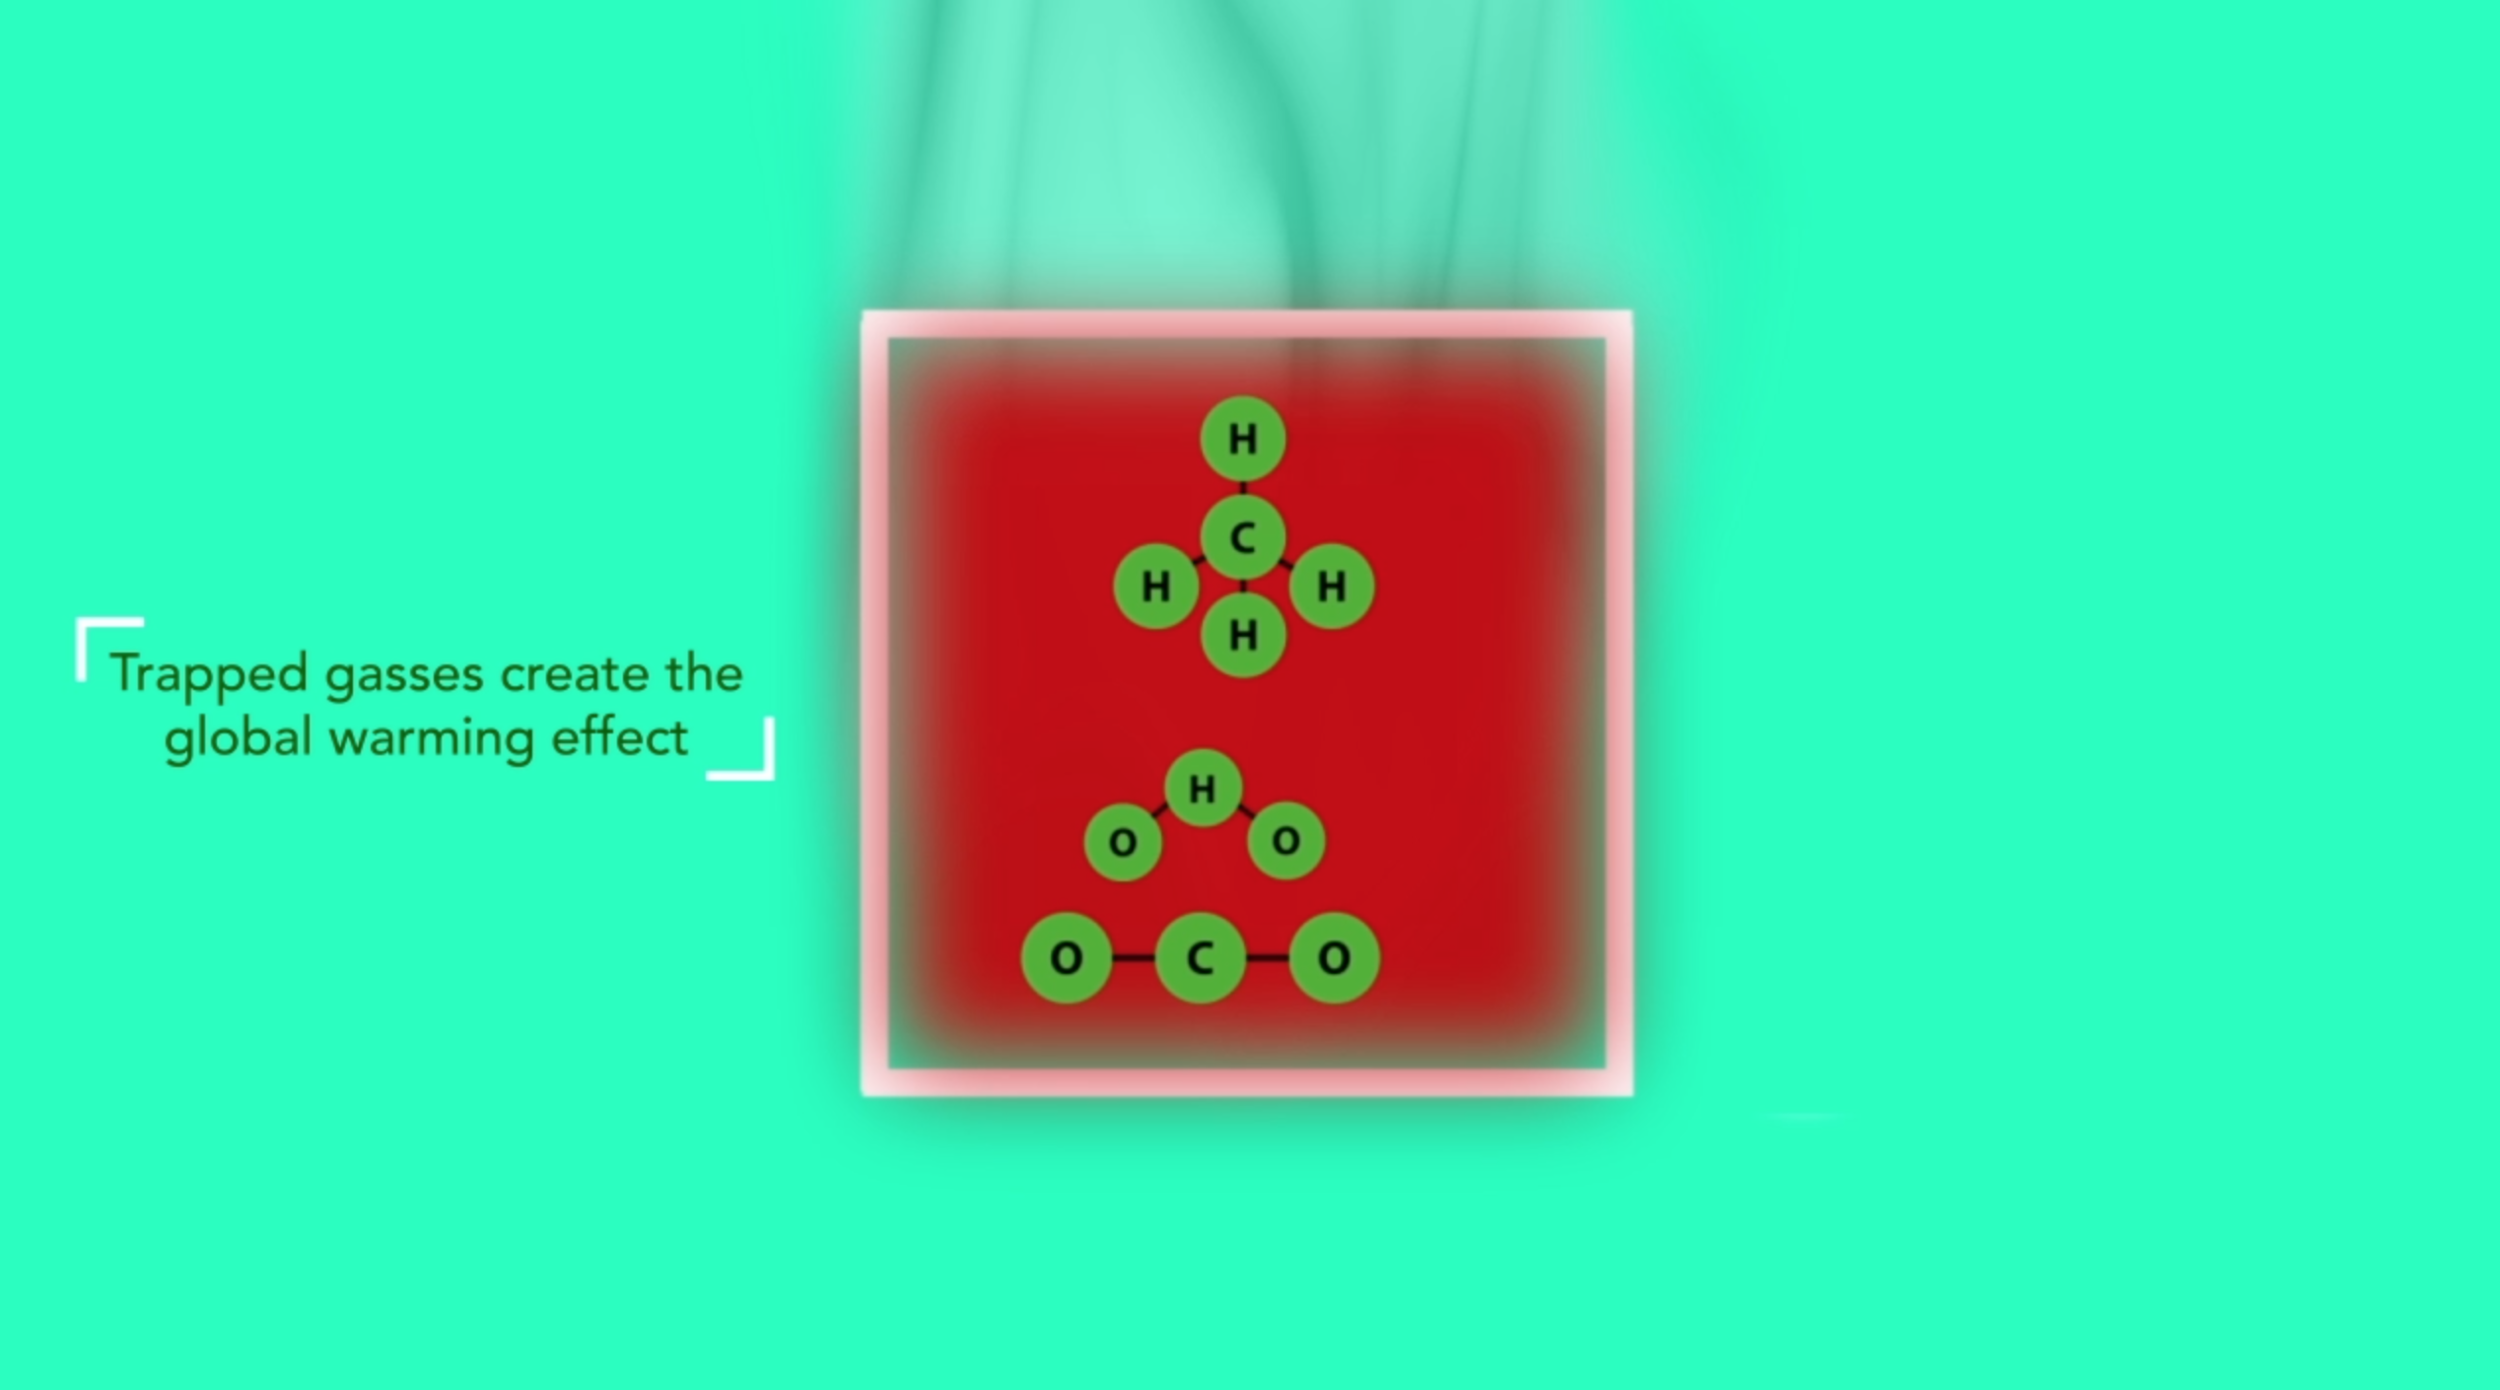
The environmental info graphic is a project that educates the public about global warming. It voices the statistics of pollution and the kind of pollution that contributes. The design illustrates how excess amounts of carbon dioxide aid in heating of the Earth and how America’s production of oil is a main contributor to producing such toxic gases. It ends with showing the present effects of this issue. How it is affecting animals, the intensity of our weather and subsequently, the damage caused by this weather.